

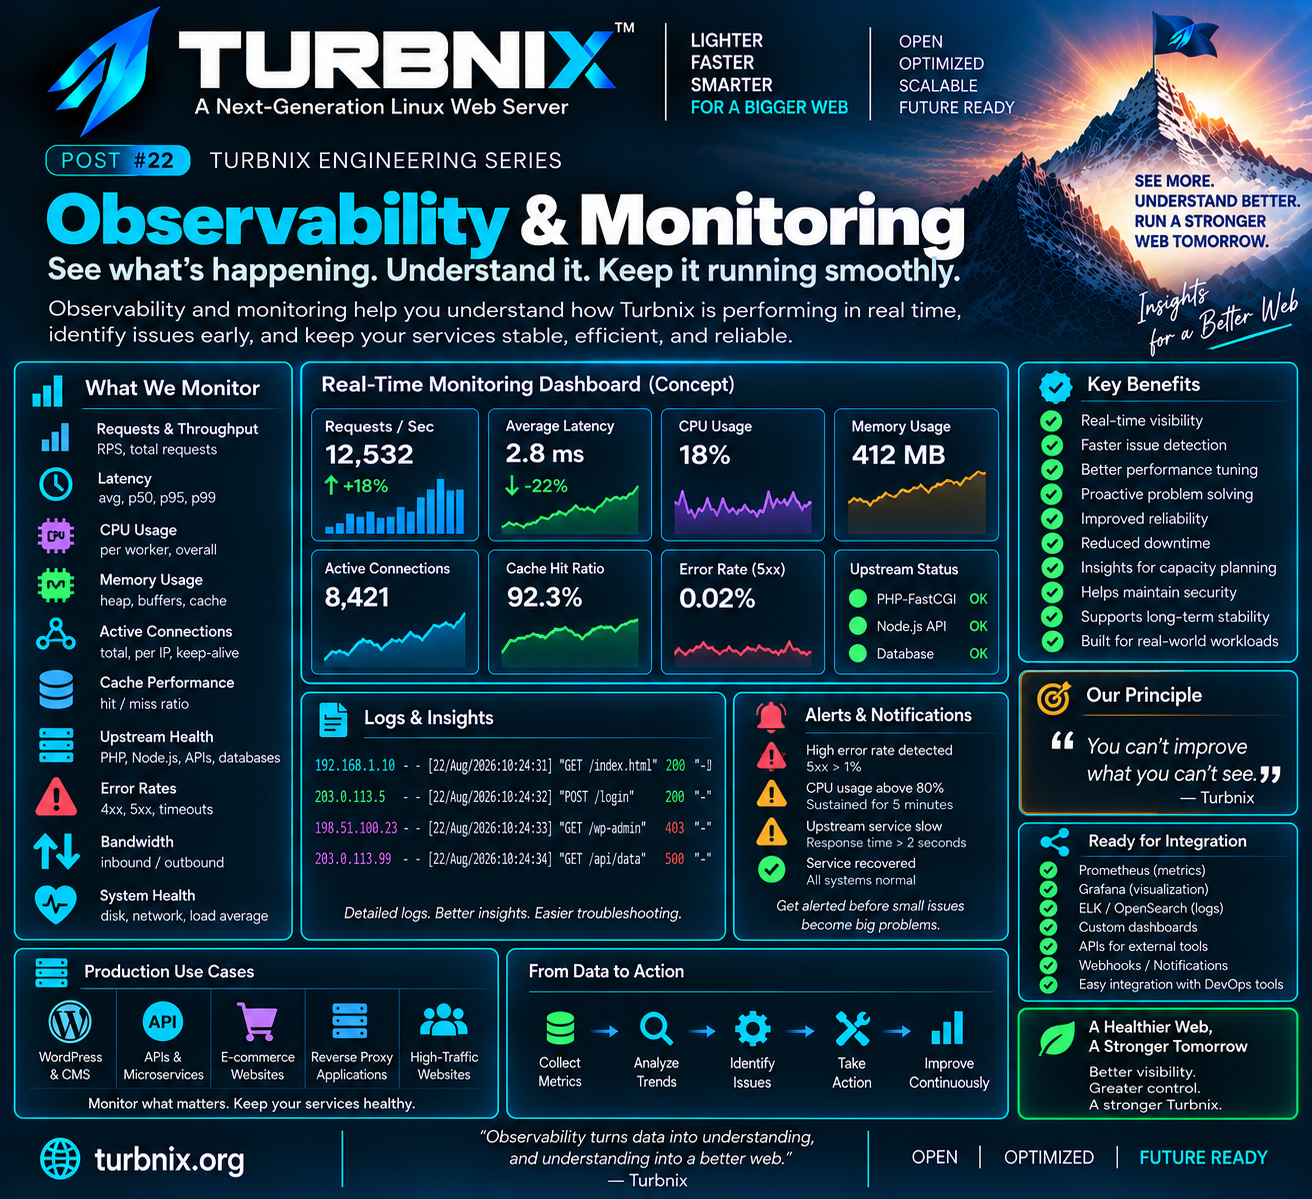
TURBNIX ENGINEERING SERIES · POST #22
Observability & Monitoring
Focuses on making server behavior measurable through metrics and operational visibility.
SOURCE CONTENT
From the original Engineering Series
This page preserves the topic and technical direction represented by the original artwork. The historical LinkedIn draft text is not reproduced as an exact quotation where the original standalone draft is unavailable.
EXPANDED TECHNICAL EXPLANATION
Observability & Monitoring
Useful telemetry includes RPS, latency percentiles, CPU, memory, connection counts, queue depth, cache hit ratio, upstream latency, errors and rejections. Metrics should reveal why performance changed, not merely report that it changed.
ENGINEERING NOTE
Ideas first. Evidence next.
Turbnix engineering claims should ultimately be validated with reproducible tests. Design goals, early observations and measured production results are kept distinct so the project can improve from evidence rather than assumptions.