BENCHMARK CENTER / ENGINEERING

Turbnix Benchmark Center

One place for reproducible Turbnix performance results, workload definitions, system-level comparisons, and the engineering evidence behind every published number.

Verified measurements only. Every published result should include the hardware, OS/kernel, software versions, configuration, workload, concurrency, measurement boundary, and raw run context needed to reproduce it.

Performance principles

Efficiency with an operating envelope

The engineering goals below describe what Turbnix aims to validate. They are not measured results or guarantees of current capability.

Useful Throughput

Useful completed work is the objective. Request counts need to be read alongside CPU, RAM, errors, latency, and backend health. A higher rate that produces more failures or pushes a dependency beyond recovery is not a useful improvement. Tests should distinguish offered load, successful completions, rejected work, and timeouts.

CPU Efficiency

CPU/request and RPS/core describe different sides of the same resource budget. Profiling should isolate event-loop overhead, connection setup, keep-alive efficiency, and avoidable work on the hot path. A proposed optimization needs evidence that it reduces cost without compromising correctness or moving the bottleneck into another part of the system.

Bounded Memory

Per-connection memory should be measured by state and tier: idle, active, and buffered connections need separate accounting. Limits should make memory behavior predictable and prevent runaway growth. Planned 10K, 50K, and 100K connection scenarios are benchmark targets, not claims of current capacity. Tests must also track reclamation after connections close.

Tail Latency

Track p50, p95, p99, and p99.9 latency together with errors and throughput. Averages alone can conceal long stalls affecting a small but important share of requests. Planned tests examine tail behavior during pressure and recovery, with enough observations and a clearly defined measurement boundary to make each percentile meaningful.

Graceful Overload

Cheap early admission control aims to shed excess load before expensive work begins. Bounded queues and concurrency budgets should protect PHP, databases, upstreams, and memory. Validation must include the return to normal load: controlled rejection during overload is useful only if the system can recover cleanly afterward.

Fairness

Hot clients or sites should not starve unrelated workloads. Per-client and per-site resource budgets are an architectural direction for sharing finite capacity. Mixed-workload tests should evaluate whether a noisy workload changes other workloads’ latency, completion rate, or ability to make progress, rather than reporting only the combined throughput.

Benchmark matrix

Production workload coverage

Each workload exposes a different cost or failure mode. The same workload definitions are used when comparing Turbnix with other production web servers.

Benchmark workloads, measurements, and test conditions
WorkloadTarget measurementsTest focus
Static ServingRPS/core; CPU/request; latency percentiles; memoryVary payload size and concurrency; separate serving cost from client or network limits.
Keep-AliveIdle/active connection CPU; memory at connection scale; latencyDistinguish idle pools, reused connections, and active request traffic.
Smart CacheCached throughput; cache-hit cost; stampede behavior; single-flight effectivenessTest warm hits, cold misses, expiration, and concurrent fills for a hot key.
WordPress CachedUseful throughput; CPU/request; cache behavior; tail latencyDocument cache eligibility and state; separate cached traffic from dynamic work.
PHP / DynamicPHP queue depth; runtime saturation; p99 latency; failure/recovery behaviorVary execution cost and backend constraints; observe queue growth and recovery.
Reverse ProxyUpstream overhead; latency delta; connection reuse; backend saturation behaviorCompare a direct-backend baseline with forwarding under equivalent conditions.
TLSThroughput; handshakes/core; CPU/requestSeparate connection setup from reused sessions and sustained encrypted traffic.
HTTP/3 / QUICThroughput; CPU efficiency; connection behavior; loss/recovery efficiencyRecord transport settings and network conditions as implementation support permits.
ReloadDropped requests; activation time; old-generation draining behaviorExercise readiness failures, live traffic, long requests, and drain deadlines.
Soak Testing24-hour / 72-hour stability; memory growth; latency drift; resource stabilityPlanned test durations, not completed runs; track resource trends and repeated lifecycle events.

Planned stress scenarios

Performance Under Pressure

A server should degrade predictably and recover cleanly. Maximizing RPS until collapse obscures queue growth, stalled work, and damage to dependencies. Planned pressure tests will track accepted, completed, rejected, and timed-out work through the full stress-and-recovery cycle.

Sudden traffic bursts

Step up offered load and observe admission, queue growth, successful completions, and recovery when the burst ends.

Slow clients

Exercise slow reads and writes to examine deadlines, bounded buffering, and capacity retained by stalled connections.

Connection churn

Repeatedly establish and close connections to expose setup cost, cleanup delays, and resource leakage.

Backend saturation

Constrain backend capacity and observe whether upstream limits keep waiting work and retries bounded.

PHP saturation

Increase dynamic work beyond runtime capacity and track queue depth, rejection, and latency isolation.

Cache stampedes

Expire a hot object during concurrent traffic and measure fill duplication, waiting requests, and backend demand.

Upstream failures

Inject unavailable or unhealthy destinations and observe health-aware routing and recovery behavior.

Retry storms

Combine backend failures with retrying traffic to check that retry budgets do not amplify overload.

Memory pressure

Reduce available memory or increase connection state to examine resource limits and predictable admission responses.

Reload-under-load

Activate a candidate generation during live work and account for cutover, draining, failures, and dropped requests.

Architecture / Feedback

Measure cheaply. Control deliberately.

The serving path should do the work needed to complete requests. Aggregation and adaptive decisions belong outside that critical path. Explore the Turbnix feature architecture for the wider design context.

Conceptual serving flow: Traffic → Cheap Admission → Event Engine → Cache, Proxy, or PHP → Backend as needed. The Adaptive Controller receives lightweight aggregated signals for CPU, RAM, connections, latency, queue depth, and runtime saturation, then feeds decisions back into admission and concurrency control. This is an architecture diagram, not a measured performance result.

Adaptive Event Engine

The performance architecture starts with cheap per-worker counters and metrics. Aggregated snapshots can summarize CPU, RAM, active connections, request latency, queue depth, and runtime/PHP saturation without placing aggregation or control logic on the request or event-loop hot path.

These signals can inform admission control, concurrency limits, fairness, and overload response. Evaluation needs to measure instrumentation cost, decision stability, and recovery behavior alongside useful throughput. The controller is an architectural approach to validate, not evidence of a specific performance gain.

Smart Cache Performance

Per-key request coalescing, or single-flight behavior, aims to prevent many requests from regenerating the same hot object. Granular bounded locking and avoiding global locks should limit contention between unrelated keys. Stale serving can keep eligible content available while a refresh runs, where policy allows it.

Cache-hit RPS alone misses the moments when a cache places the greatest demand on an application. Planned tests include synchronized expiration, failed fills, cold starts, and mixed hot and cold keys. Fill duplication, lock contention, waiting work, and backend demand must be measured alongside the cost of a successful hit.

PHP Workload Performance

Bounded PHP queues and controlled saturation aim to prevent dynamic requests from consuming unbounded memory while they wait for execution. Process supervision, crash detection, bounded restart/backoff, and health checks are part of the intended runtime behavior, with failure isolation protecting unrelated work.

Planned validation includes slow execution, worker crashes, repeated startup failure, and constrained database capacity. Queue depth and completed work should be interpreted together with overall server latency and backend stability. Fast acceptance into a growing queue is not the same as fast completion.

Reverse Proxy Performance

Connection reuse and upstream pools are intended to keep forwarding overhead low while respecting backend capacity. Backend health, bounded retries, and saturation protection need to work together so a struggling destination does not receive a retry storm on top of its original traffic.

Tests should compare forwarding with a direct-backend baseline and disclose where latency is measured. They should distinguish connection setup from reuse, account for retry attempts, and include failing or slow upstreams. Low forwarding overhead is a design goal whose value depends on correct behavior when the backend is unhealthy.

TLS + HTTP/3

Transport evaluation should separate TLS throughput, handshakes/core, and encryption CPU cost. Session behavior, connection reuse, certificate and cipher settings, and payload size all belong in the test context. Handshake-heavy traffic and sustained encrypted transfers stress different parts of the system.

HTTP/3/QUIC efficiency also needs evaluation under loss, changing connection conditions, and recovery. Planned coverage depends on implementation availability and maturity; these protocol goals do not establish production readiness. Results should identify the exact supported configuration and the limitations of the test.

Large-System Efficiency

CPU locality, memory locality, NUMA awareness, and worker placement are architectural considerations for larger systems. Minimizing unnecessary cross-core coordination may reduce shared-state contention, but placement choices can also produce imbalanced work or remote memory access.

NUMA optimization is not presented as fully implemented. Planned profiling should compare placement strategies, identify coordination costs, and disclose topology and affinity settings. A technique should earn its place through measured benefit on the relevant hardware and workload, rather than through assumptions about scale.


Benchmark integrity

Reproducible by Design

Published benchmarks must include enough context to repeat the experiment and challenge its conclusions. The test setup is part of the result, not an optional footnote.

Comparisons should use equivalent configurations and disclose bottlenecks, including limitations in the client, network, or backend. Offered load, errors, and successful completions should be reported together so rejection or timeout behavior cannot masquerade as throughput.

Repeated runs, a documented warm-up procedure, and a consistent measurement boundary help distinguish an architectural improvement from noise. Correctness checks and resource accounting remain necessary even when a throughput result looks promising.

  • Hardware specifications
  • OS/kernel
  • Software versions
  • Exact configuration
  • Concurrency
  • Connection model
  • Payload size
  • TLS settings
  • Cache state
  • Backend configuration
  • Test duration
  • Warm-up procedure
  • Client/load-generator details

System comparison

Turbnix vs Nginx vs Apache vs OpenLiteSpeed

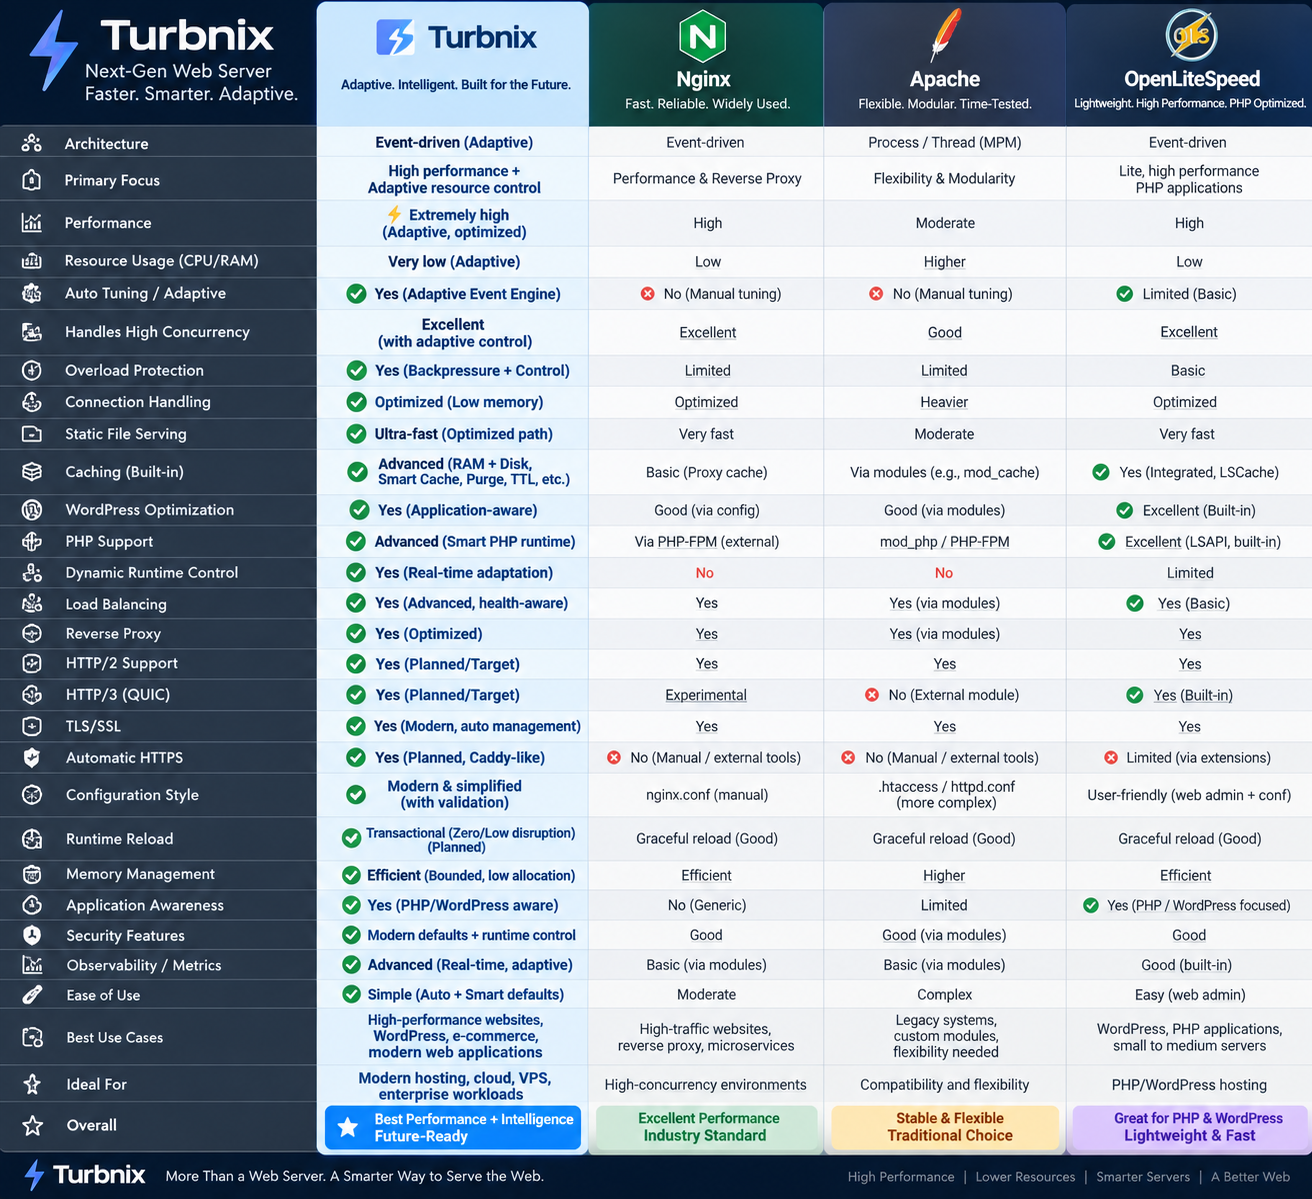
Use this comparison as the architectural context for the benchmark program. Quantitative RPS, CPU, RAM and latency values belong in the verified result tables below once a reproducible run has been completed.

Turbnix compared with Nginx, Apache and OpenLiteSpeed across architecture, performance, resource usage, concurrency, caching, PHP, proxying, TLS, HTTP/3, memory management and other server capabilities.
Architecture/capability comparison supplied for Turbnix positioning. It is not a substitute for measured benchmark numbers.

Benchmark results must be earned by measurement.

No synthetic RPS, p99, CPU/request, RAM, TLS or HTTP/3 number is invented here. When a run is published, this section should show the exact result, test command, machine, software versions, configuration and raw data so anyone can reproduce it.

Explore the engineering

Follow the work behind the measurements

Review the benchmark methodology, inspect the implementation, and follow development in the official web server repository.